Akira TAKEISHIInter-firm Division of Labor in the Japanese Auto Industry at a Crossroads: Where Have Some (not All) Keiretsu Gone?
Research Question
Since Coase’s (1937) seminal work, many researchers in a variety of fields, including economics, sociology, and management, have addressed how the boundaries of the firm are determined and why. The auto industry has served as one of the most investigated empirical fields, and the case of Japan has drawn a special attention due to its success in the international competition and its characteristics in, among others, supplier management.
A primary focus has been put on a particular relationship that we have observed between Japanese OEMs and their suppliers ── long-term, close, and trust-based relationship often involving financial and personnel ties. Yet, whether such relationship, which we call “keiretsu” relationship, has contributed to the OEM’s competitiveness or not remains disputed among researchers as well as practitioners.
Traditionally, many studies claimed that keiretsu relationship with suppliers played a significant role for Japanese OEMs’ competitiveness in manufacturing and product development. Such argument stimulated broad interests in long-term relationship between firms or, more generally, a hybrid mode between hierarchy and market (Powell, 1990).
More recently, however, views on keiretsu have been changed significantly, since Japanese economy stumbled in the early 1990s. Keiretsu, once heralded as one of Japanese competitive weapons, has been accused as a source of failure since the mid-1990s (Cusumano and Westney, 2010). Strong tie is regarded as Japan’s weakness in the international competition (Lincoln, 2011). As empirical evidence for such argument, keiretsu relationship was indeed dismantled at some Japanese OEMs, particularly at Nissan and Mazda. Yet, to make this issue complicated and unsettled, some OEMs have maintained keiretsu, particularly at Toyota and Honda. It suggests that not all keiretsu are created equal.
Why have some keiretsu disappeared in the Japanese auto industry? Why have some others survived? What have decided the destiny of keiretsu between disappeared and survived? This research, which is jointly conducted with Tetsuya Kikutani, Yoshihisa Noro, and Ryuichi Nakamoto, addresses these questions empirically.
Our Previous Research
This research is the second phase of our research project to explore the determinants of firm boundaries in the Japanese auto industry. Previously, in the first phase, our research empirically investigated what determined the firm boundaries in the Japanese auto industry. A frequently cited empirical paper on firm boundaries in the auto industry is Monteverde and Teece (1982). They demonstrated that transaction cost, measured by engineering efforts and firm specificity to design components, did indeed matter for the vertical integration decision by OEMs (GM and Ford) in the U.S auto industry. Drawing on quantitative data sets we have built up on the Japanese auto industry, our previous study replicated their analysis and extended it in two directions in order to better understand what determines firm boundaries.
First, for the dependent variable, we adopted more diversified choices of firm boundaries. Rather than the simple “make or buy (hierarchy or market)” choices, we examined four choices of component procurement sources: in-house production, own keiretsu suppliers, other OEMs’ keiretsu suppliers, and independent suppliers. Second, for independent variables, we introduced a set of new variables in addition to transaction cost. Our study demonstrated that not only transaction cost but also product architecture, scale economy, and dual economy did matter in determining firm boundaries among the four choices of procurement sources in the Japanese auto industry (Nagaoka, Takeishi, and Noro 2007, 2008).
Building upon this research outcome, which confirmed that our analytical framework could explain the firm boundaries in the Japanese auto industry, we have moved to the current (second) phase of our research, as described above. Empirical Data
The primary data set for this research, in both the first and second phases, is a set of panel data on how much (in volume) each of seven Japanese OEMs procured each of the 54 components from which suppliers over thirty years, once every three years from 1984 to 2016.
The data set is compiled from reports published by IRC, a Japanese market research company. While the original reports present data on about 200 components each year, our study focuses on 54 components that have appeared in every report throughout the preiod. The data from 1984 to 2002 were used for our previous study. For the current study, we have built up the data until 2008, and are in the process of extending the data to 2016.
We also use another data set taken from the results of a questionnaire survey with engineers working for four Japanese OEMs to measure technological and economic characteristics of the 54 components. This data set was used for our previous study. Other industry and financial data as well as interviews with OEMs are also used for our analysis.
What Happened?
Based on the primary data set on component procurement, let us look at how the role of keiretsu suppliers changed over time in the Japanese auto industry. Figure 1 shows how much Japanese OEMs on average procured their components from the three sources: keiretsu suppliers, independent suppliers (including other OEMs’ keiretsu suppliers), and in-house from 1984 to 2008. The procurement ratio from keiretsu suppliers declined from above 35% during the 1990s to less that 30% in the middle of the 2000s, and that from independent suppliers increased. As some researchers have argued, keiretsu seems to have lost some ground in Japan.
Yet if we look at individual OEMs, different pictures emerge. As Figure 2 reveals, Nissan’s procurement ratio from keiretsu suppliers dropped suddenly from around 60% until 1999 to 20% in 2005, after Nissan forged an alliance with Renault in 1999 and then introduced a new policy led by the new CEO, Carlos Ghosn. So is the case with Mazda, where a new CEO was assigned from Ford in 1996. However, Toyota maintained the ratio high at over 60% and stable over the two decades. Honda also maintained the ratio at over 40%, although it went up slightly until 1999 and then went down slightly afterwards.
Figure 1: Component Procurement Sources for Seven Japanese OEMs from 1984 to 2008 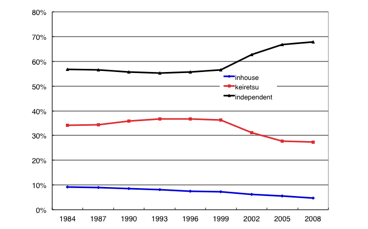 Note: The vertical axis shows how much in % the seven OEMs on average procure from the source. Un-weighted average for seven OEMs and for 54 components.
Source: Compiled from IRC data
Figure 2: Component Procurement from Keiretsu Suppliers by OEMs from 1984 to 2008 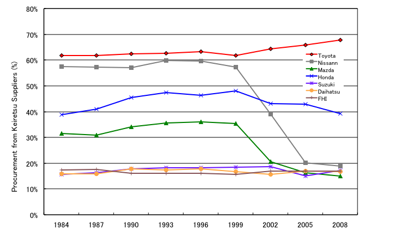 Note: The vertical axis shows the ratio of procurement from keiretsu suppliers: the amount of procurement from keiretsu suppliers divided by the amount of total procurement. Un-weighted average for 54 components for each OEM.
Source: Compiled from IRC data Overall, we observe some significant decline in the role of keiretsu relations in the Japanese auto industry, which used to be highly praised for its effective management of keiretsu relationship. At the same time, however, we observe some difference among OEMs. While some OEMs dismantled keiretsu relationship, others have maintained after all these years. We must understand the change and the difference. Why have some keiretsu gone, while others have survived? By addressing this question empirically, our research attempts to better understand keiretsu relationship, a hybrid mode of firm boundaries, neither market nor hierarchy.
Possible Answers
Since this study is still in the early stage of analysis, we cannot present our answers. Instead in this research note we would like to suggest three candidates of factors (hypotheses) that we expect to explain what has happened to keiretsu in the Japanese auto industry: (1) OEM’s production volume; (2) different types of keiretsu; and (3) relationship across multiple components.
OEM production volume
First, we would argue that OEM’s production volume and its change would determine whether the keiretsu would be maintained or not. Our previous research found that larger OEMs in production volume could have more keiretsu suppliers than smaller OEMs. If this is true, differences and changes in production volume could explain how much each OEM could have and maintain keiretsu suppliers.
Figure 3 shows what actually happened for each OEM in the production volume and procurement ratio from keiretsu suppliers from 1984 to 2008. The picture is different across OEMs. In the cases of Nissan and Mazda, although the production volume decreased substantially during the 1990s, they maintained the procurement ratio from keiretsu suppliers until late 1990s. However, after that, they dropped the ratio significantly. In the case of Toyota, the production volume decreased but not as much as Nissan, and Toyota maintained the ratio at high. We observe the similar pattern in the case of Honda.
More detailed analysis of the relations between production volume and keiretsu relationship will be one of our focuses.
Figure 3: Production Volume and Procurement from Keiretsu Suppliers by OEMs from 1984 to 2008
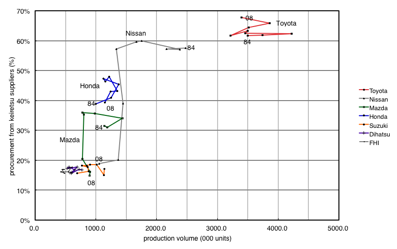 Note: Production volume includes only domestic production, excluding overseas production.
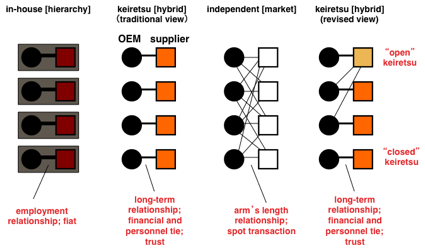
Source: Compiled from data by IRC and JAMA (Japan Automobile Manufacturers Association) Two types of keiretsu: open and closed Second, we would argue that there are two types of keiretsu relationship and this difference would determine whether the keiretsu would be maintained or not. Figure 4 illustrates our proposed view on two types of keiretsu relationship. The first three columns from left depict the existing view on the keiretsu along with hierarchy (in-house) and market (independent suppliers). The difference among the three modes is the nature of relationship. Keiretsu is neither employment relation (in-house) nor arm’s-length spot market transaction (independent suppliers), but market transaction based on long-term and trust-based relationship often with financial and personnel ties.
We don’t disagree to this view, which we think captures essentials of keiretsu relationship. However, we would like to argue that, within this keiretsu mode, there are two types, as shown in the fourth column at right. One is the keiretsu relationship where the supplier supplies its component only to its keiretsu OEM, which we call “closed keiretsu.” The other is the keiretsu relationship where the supplier supplies its component to not only its keiretsu OEM but also other OEMs, which we call “open keiretsu.” It should be noticed that this distinction could not be captured when one examines only dyadic relationship between the OEM and the keiretsu supplier. One should look at not only the dyadic relationship but also other relations between the keiretsu supplier and other OEMs, or to put it differently, indirect relations for the OEM with other OEMs through the keiretsu supplier.
Figure 4: A Revised View on Keiretsu Relationship
 Drawing on our data set, we could indeed observe these two different types of keiretsu in the Japanese auto industry, as shown by Figure 5. The vertical axis shows the ratio of the amount of the keiretsu suppliers’ supply to non-keiretsu OEMs divided by the amount of their supply to the keiretsu OEM, which we assume measures the openness of keiretsu relationship. When the relationship is closed, the ratio is zero since the keiretsu suppliers supply no volume to other OEMs. If they supply more, then it goes up. The higher is the ratio, the more open is the keiretsu relationship.
The figure compares the openness of keiretsu relationship by OEMs for the period from 1984 to 1996, a period before the structural change took place at Nissan and Mazda in the late 1990s. Among the seven OEMs’ keiretsu suppliers, Toyota’s were the most open. As shown, about 30% of their sales went to outside Toyota. In contrast, Nissan’s keiretsu suppliers were less open than Toyota’s and Honda’s. Mazda’s were almost closed to other OEMs.
Openness may reflect the policy of the OEM to encourage (or at least not discourage) its keiretsu suppliers to supply their components to other OEMs. It may also indicate the competitiveness of keiretsu suppliers in the component market. In any case, more open keiretsu suppliers could likely take advantage of a large scale of economy and a wider scope of customer relations. Many of Toyota’s keiretsu suppliers had a high share in the industry because they supply a large volume to its keiretsu OEM, Toyota, and some additional volume to other OEMs. This is the advantage that Nissan’s and Mazda’s keiretsu suppliers could not enjoy because they are less open.
We will pay a special attention to the openness of keiretsu relationship and its effects on its destiny: maintained or dismantled.
Figure 5: “Openness” of Keiretsu Suppliers by OEMs from 1984 to 1996
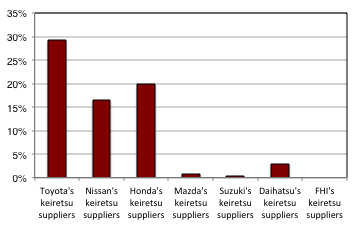 Note: The vertical axis shows the openness of keiretsu relationship: the ratio of the amount of keiretsu suppliers’ supply to non-keiretsu OEMs divided by the amount of their supply to own keiretsu OEM (%). Un-weighted average for 54 components from 1984 to 1996.
Source: Compiled from IRC data Relations across multiple components
Third, we would argue that the scope of keiretsu relationship in terms of component types would affect whether the keiretsu would be maintained or not. An OEM could procure from a supplier multiple types of components rather than a single type of component. Sourcing multiple components would likely allow the OEM to take advantage of economy of scope in inter-firm relationship across different components and make the relationship more indispensable.
Our analysis shows that some OEMs, in particular, Toyota, tended to procure more types of components from keiretsu suppliers, as shown in Figure 6. We would like to take this factor into account in our analysis.
Figure 6: Average Number of Component Types Procured from Keiretsu Suppliers by OEMs from 1984 to 1996
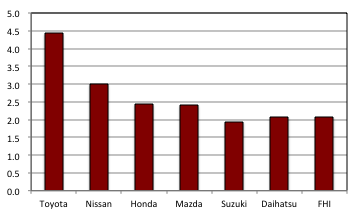 Note: The vertical axis shows the average number of component types procured from keiretsu suppliers for the period from 1984 to 1996. Source: Compiled from IRC data Expected Argument
Although our empirical analysis is yet to be done, if these factors, among others, could indeed explain what happened in keiretsu relationship in the Japanese auto industry, we would contend that we could better understand determinants of firm boundaries by extending the scope of analysis, i.e. by looking at multiple transactions in time and space, including both direct and indirect ones. An extended scope of analysis is expected to reveal what the existing research that has examined only individual and direct transactions, such as transaction cost economics, could not capture.
For example, it is too early to tell, but if openness does matter for keiretsu relationship to survive, it means that not all OEMs could maintain keiretsu. Only those OEMs that have built up open (i.e. competitive) keiretsu could maintain keiretsu in the industry.
Further research should explore why and how some OEMs (Toyota and Honda) could have keiretsu more open (i.e. competitive) than others (Nissan and Mazda) could. It would reveal what would be viable keiretsu relationship and make a contribution to the study of inter-firm relations and, more broadly, the theory of the firm.
References
Coase, R.(1937)“The Nature of the Firm,” Economica 4 (16): 386-405.
Cusumano, M. and E. Westney(2010)”Beyond the “Miracle” and “End” of Japan: How the Japanese Firms’ Competitiveness Has been Viewed in the West.” In Aoshima, Y., A. Takeishi and M. Cusumano (eds.), End of “Made in Japan”? Toyo Keizai Shimpo-sha, 2010, pp. 24-65 [in Japanese].
Lincoln, J.(2011)”Interorganizational Networking: A Japanese Strength?” Keynote Speech, Annual Meeting for the Academic Association of Organizational Science、Kyoto.
Monteberde, K. and D. Teece (1982) “Supplier Switching Costs and Vertical Integration.” Bell Journal of Economics, 13 (1): 206-213.
Nagaoka, S., A. Takeishi, and Y. Noro (2007) “Determinants of Firm Boundaries: Empirical Analysis of the Japanese Auto Industry from 1984 to 2002” NBER Working Paper No. 13063.
Nagaoka, S., A. Takeishi and Y. Noro (2008), “Determinants of Firm Boundaries: Empirical Analysis of the Japanese Auto Industry from 1984 to 2002.” Journal of the Japanese and International Economies, 22, pp. 187-206.
Powell, W. (1990). “Neither Market Nor Hierarchy: Network Forms of Organization.” In B. Staw and L. Cummings (eds.), Research in Organizational Behavior (Vol. 12). Greenwich, CT: JAI Press, pp. 295-336.
|


|
 |
Recherche | |
FFJ Research Statement | |
Akira TAKEISHI |

| Inscrivez-vous à notre Lettre en cliquant ici |
*En cas de problème, vous pouvez aussi vous inscrire en envoyant un mail à sympa@ehess.fr, avec pour titre "subscribe ffj_french_news".
| Contact | | Mentions légales | | © Copyright Fondation France-Japon de l'EHESS | | Réalisation Aneol |  |