Hiroshi TERUYAMAJapan’s labor market and the rise in unemployment since 1990
Unemployment is statistically defined as a situation in which persons are not in, can immediately engage in, and are seeking paid employment or self-employment. In Japan, the Ministry of Internal Affairs and Communication’s Labour Force Survey classifies the population aged 15 years and above into three categories according to their labor force status: “employed,” “unemployed,” and the “non-labor force”. Persons who worked even a little for one week at the end of the month are “employed.” Persons who have no job but are looking for one and are ready to start immediately if work is available are “unemployed.” The “labor force” is the sum of all employed and unemployed persons. Persons who are neither employed nor unemployed are the “non-labor force” or “not in the labor force”.
The unemployment rate is the ratio of unemployed persons to the labor force. Figure 1 shows Japan’s unemployment rate since 1990. It is well known that Japan’s unemployment rate was low and stable before the 1990s. However, as shown in Figure 1, the country experienced a secular increase in unemployment over the 1990s. The unemployment rate was at the 2-percent level in 1990 and had risen to over 5 percent by 2001. A remarkable feature of the unemployment rate over this period is that it did not drop even in an expansion. It finally started to decline during the longest expansion of 2002―2007. The decline was gradual and it took over 5 years to reach the 4-percent level, which is far higher than that at the beginning of the 1990s. After the global financial crisis in 2008, the unemployment rate rose sharply within a short period. Thereafter, it has been decreasing slowly in the current expansion.
Japan’s unemployment rate since the 1990 can be considered easy to increase and difficult to decrease. The rising unemployment rate is on account of structural changes in the labor market. However, the key factors causing this rise have not been specified in the economics literature. In this article, I review several opinions concerning the factors responsible for the rapid increase in Japan’s unemployment rate and undertake some investigations.
Labor flows into and out of an unemployment pool occur simultaneously. The unemployment rate increases when inflows to unemployment exceed outflows from unemployment. Unemployment inflows consist of flows from employment to unemployment (hereafter, EU flows) and flows from the non-labor force to unemployment (NU flows). On the other hand, unemployment outflows are the sum of flows from unemployment to employment (UE flows) and those from unemployment to the non-labor force (UN flows). Figure 2 shows these flows from January 1990 to August 2010, which I calculate based on figures from the Labour Force Survey.[1]
Let us begin by considering the flows between employment and unemployment. In the beginning of the 1990s, EU flows and UE flows were almost equivalent. However, during the recession after the stock market bubble burst, EU flows exceeded UE flows and the difference between the two flows increased. This situation continued until 2002 and resulted in a large increase in unemployment. Why did EU flows continue to grow even in expansions?
On the labor demand side, employment adjustment costs may have risen. It is said that Japanese firms faced high employment adjustment costs since the firms bore the various costs of workers’ skill formation and dismissals were legally regulated. It seems that such high adjustment costs reduced the speed of employment adjustment and thus stabilized unemployment fluctuations due to business cycles. Employment adjustment costs depend on various economic and institutional factors such as cooperate governance, financial affairs including borrowing conditions, labor unions, and types of employment. It is natural to think that some structural changes in those factors reduced the adjustment costs, causing amplified labor flows between employment and unemployment. Growing EU flows over UE flows even in an expansion might reflect an adjustment process of excess employment within firms, resulting from an accumulation of labor hoarding induced by the high adjustment costs before the 1990s. The empirics of employment adjustment speed have been intensively pursued by Japanese labor economists. However, there is no consensus so far about the factors accelerating the speed.
Another demand factor that may be responsible for increasing unemployment is rigidity of wages. It has for long been claimed that in Japan, flexible real wages reflecting firms’ performance induces employment stability. Real wage flexibility was considered to come from Japanese employer–employee customs, for example, from enterprise unions and bonus payments. Real wages are adjusted by changing nominal wages. Real wage adjustment by means of nominal wage changes functioned effectively because of employer–employee coordination in Japan. However, it should be noted that price levels had been increasing in most periods before the 1990s, and thus, it was possible to reduce real wages without cutting nominal wages. Under the current deflationary environment, reducing real wages is difficult because nominal wages are downward rigid and Japanese wage determination has lost its flexibility to adjust real wages.
A remarkable feature in the Japanese labor market since the 1990s is the increase in “non-regular workers.” In Japan, contingent workers and part-time workers are collectively called “non-regular workers.” The share of non-regular workers in the total population of employed workers was 20 percent in 1990. It continued to increase and reached 35 percent in 2011. The increase was brought about by both the demand and supply sides of labor. As regards labor demand, non-regular workers are sought as short-run adjustable labor because their training costs are generally low and dismissal regulations for them are not so strict. In addition, their labor costs, including welfare expenses, are lower than those of regular workers. As regards labor supply, non-regular jobs are accepted as flexible types of employment. However, in a recession, workers who desire regular jobs engage unwillingly in non-regular jobs. One-third of non-regular workers are thought to choose such types of job involuntarily.
There is an influential view that unemployment can be reduced if unemployed workers temporarily take up non-regular jobs in a recession. However, it is a fact that the number of non-regular workers continued to increase even in the expansion 2002–2007. During the period, the number of unemployed reduced by about 1 million. During the same period, the number of regular workers declined by about 0.3 million. On the other hand, the number of non-regular workers increased to 2.3 million. Therefore, it can be said that a worker who avoided unemployment by getting a non-regular job in the previous recession was not be able to return to a regular job during the successive recovery. On the contrary, conversions from regular to non-regular jobs progressed among firms. Thus, large UE flows in those periods reflect the growing number of non-regular workers. The average length of employment is shorter and the unemployment probability is higher among non-regular workers than among regular workers.[2] An increase in non-regular workers whose employment is fragile raises frictional unemployment. In addition, the low costs of dismissal for non-regular workers also augment unemployment during a recession. The latter fact is typically reflected in the fact that an unemployment increase in the recession beginning 2007 was brought about by the rapid and large expansion of EU flows. It seems that in the recession, non-regular jobs had already lost the ability to absorb unemployment since the regular to non-regular transition process was almost complete.
Next, let us briefly look at flows between unemployment and the non-labor force. In Figure 2, we find that until the beginning of the 2000s, the increase in UN flows exceeded that of NU flows continuously and thus net flows into the non-labor force out of unemployment contributed to restrain any unemployment increase. Such an effect is called the “discouraged worker effect,” and it was held to have played a significant role in the stability of Japan’s unemployment before the 1990s. However, the effect seems to cease to work in recent recessions. This is also a reason for the sustainable high unemployment rate arising from the labor supply side.
Causes of unemployment increase can be divided into two main factors. One is a prolongation of unemployment spells. The other is an increase in the number of workers who lose jobs frequently. As we have seen, the upward unemployment trend in the 1990s was accompanied by increases in both inflow into and outflow from unemployment. The fact suggests a rise in the frequency of short-spell unemployment. At the same time, we observe quite a number of periods in which the inflow into unemployment exceeds the outflow from unemployment, thus extending the average unemployment spell.[3]
In order to see which factor is more important for the upward trend of unemployment since the 1990s, let us decompose the ratio of unemployed people to the population aged 15 or above (the unemployment-population ratio, hereafter) into two parts. The steady state unemployment-population ratio can be expressed as the product of two steady state values: one is the unemployment frequency, i.e., the number of worker flows into unemployment per number of the population aged 15 and above; and the other is the average unemployment duration, i.e., the number of unemployed workers per number of worker flows out of unemployment. Figure 3 indicates the result of the decomposition, which I calculate based on the estimated labor flows shown in Figure 2. Until the recession that began in 1997, both the steady state values of frequency and duration had been rising. During the recession, the unemployment duration had stopped increasing but the frequency continued to grow. This phenomenon lasted until 2002 and ended with a historically high unemployment level. Thus, we can conclude that the rapid and large increase in the unemployment rate from 1997 to 2002 was caused mainly by the enhanced frequency of unemployment, i.e., an increase in the number of fragile jobs.
Several recent empirical studies suggest that transition from a non-regular job to a regular job is limited in the Japanese labor market. If this is true, a rise in non-regular jobs would persists over a period of recession. This means that a recession raises the unemployment frequency for a long time and thus induces the sustainability of unemployment rate. The characteristic coincides with the rapid rises and sluggish declines in the unemployment rate shown in Figure 1. Therefore, it is safe to say that the increasing amount of non-regular jobs played a substantial role in the upward unemployment trend. However, Figure 3 also shows that in the recent recession of 2007–2009, the steady state unemployment duration rose sharply up to the highest level since the 1990s. This suggests that the structural change in unemployment in Japan might be entering upon a new phase.
[1] Owing to the Great East Japan Earthquake, the Labour Force Survey does not publish labor flow data from March to August in 2011. Moreover, I use the 12-month moving average because the original data exhibit strong seasonality. Therefore, the labor flow data terminate in August 2010.
[2] According to Useful Labour Statistics 2012 (The Japan Institute for Labour Policy and Training), for example, the turnover rate was less than 4 percent for regular workers and 8 to 12 percent for non-regular workers, and the unemployment rate was 2 to 3 percent for regulars and 3 to 5 percent for non-regulars since the 2000s.
[3] Actually, according to Useful Labour Statistics 2012, the share of unemployed workers whose unemployment spells exceed 1 year, relative to the total number of unemployed workers, was 15 to 20 percent in the beginning of the 1990. It has been over 30 percent since 2002.
Figure1: Unemployment rates in Japan (monthly, seasonally adjusted) 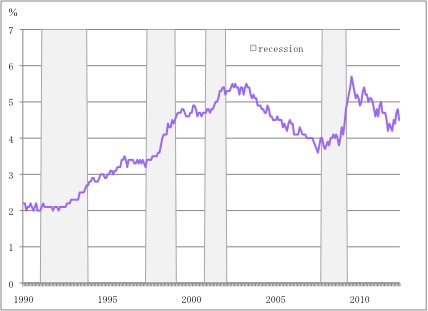 Source: Labour Force Survey (Ministry of Internal Affairs and Communication)
Figure2: Labor flows into and out of unemployment (monthly, 12month moving average) 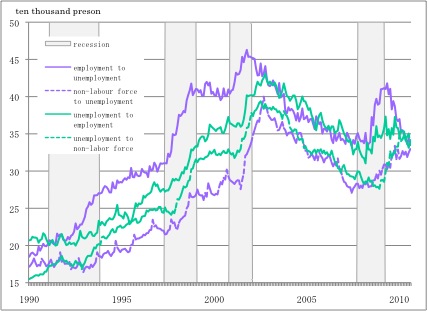 Source: Author's calculation based on Labour Force Survey (Ministry of Internal Affairs and Communication) Figure3: Unemployment frequency and duration (monthly, 12 month moving average) 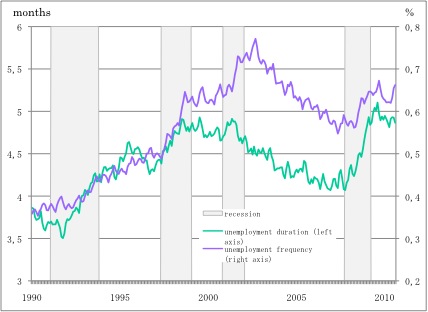 Source: Author's calculation based on Labour Force Survey (Ministry of Internal Affairs and Communication) |


|
 |
Recherche | |
FFJ Research Statement | |
Hiroshi TERUYAMA |
.jpg)
| Inscrivez-vous à notre Lettre en cliquant ici |
*En cas de problème, vous pouvez aussi vous inscrire en envoyant un mail à sympa@ehess.fr, avec pour titre "subscribe ffj_french_news".
| Contact | | Mentions légales | | © Copyright Fondation France-Japon de l'EHESS | | Réalisation Aneol |  |